


")
Wood density is a crucial indicator of trees’ carbon investment strategies, impacting productivity and carbon storage between wood species. However, the global variation in density and environmental controls remain poorly understood, preventing accurate predictions of forest carbon stocks.
Now, global researchers have analysed information from more than 1.1 million forest inventory plots, which, with more than 10,700 tree species, have provided the world’s first spatially explicit understanding of global wood density, distribution, and drivers.
Published in Nature Ecology and Evolution, The global distribution and drivers of wood density and their impact on forest carbon stocks, the findings reveal a pronounced latitudinal gradient, with wood in tropical forests 30% denser than in boreal forests. “Mean temperature and soil moisture emerged as primary factors influencing the variation in wood density,” according to the research, which “underscores the essential role of abiotic (or non-living environmental) factors in determining wood density in forest ecosystems.”
Using geospace mapping, the researchers developed random forest models using 62 global layers of climate, topography, soil, vegetation, and human activity for all tree species. This resulted in a high-resolution global model that provides critical information on the structure and biomass distribution of the world’s forests.
“Our analysis identifies temperature as the dominant driver of global wood density variation, with a more than three times greater effect than any other variable,” the research said. “Highlighting temperature as a selective pressure and filter of global wood density. Other factors, such as soil moisture, also affect wood densities but are more noticeable at regional scales.”
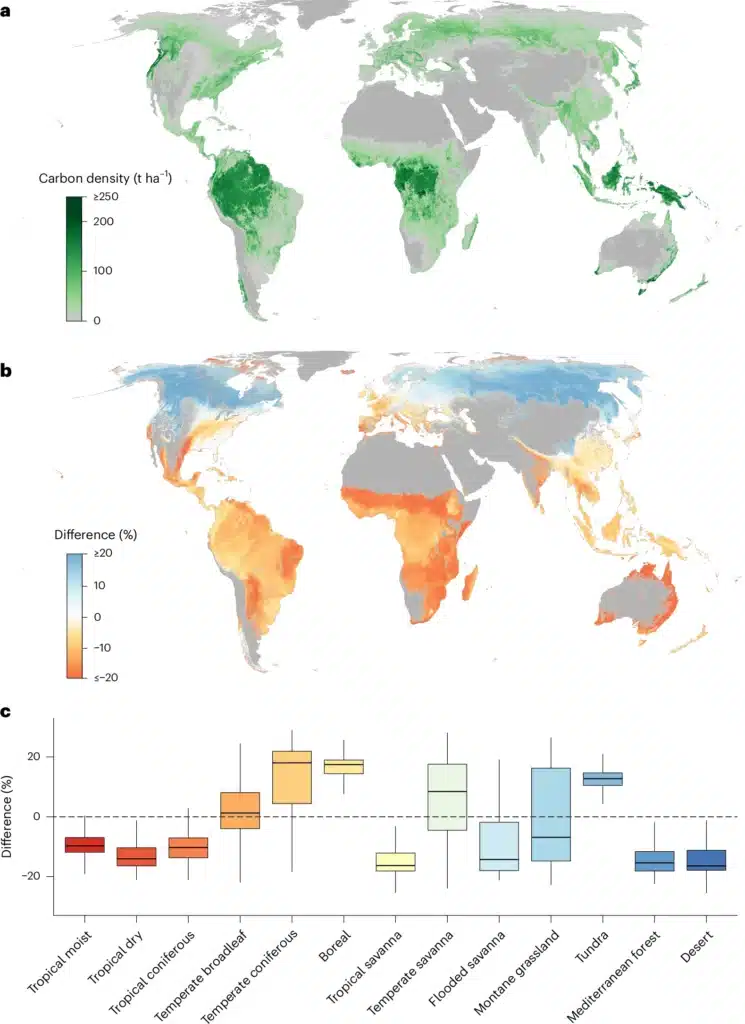
In addition, the study highlights the prominent role of disturbances, such as human modification and fire risk, in influencing wood density at more local scales. Spatial variation of wood density notably changes the estimates of forest carbon stocks, leading to differences of up to 21% within biomes. “Our research contributes to a deeper understanding of terrestrial biomass distribution and how environmental changes and disturbances impact forest ecosystems,” the study said.
For more information: Mo, L., Crowther, T.W., Maynard, D.S. et al. The global distribution and drivers of wood density and their impact on forest carbon stocks. Nat Ecol Evol (2024). https://doi.org/10.1038/s41559-024-02564-9